 Image 1 of 1
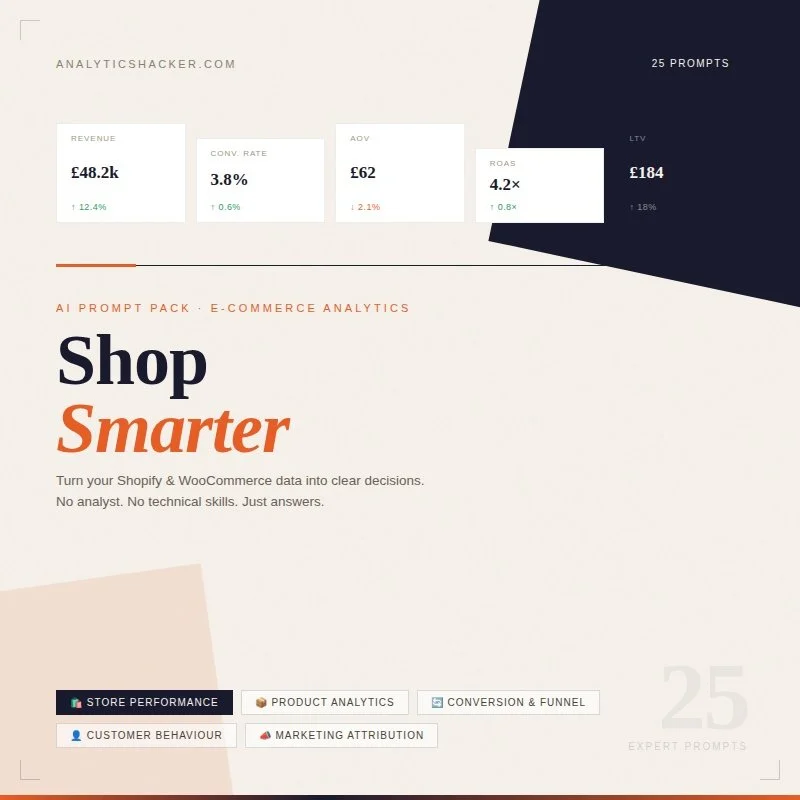
Shop Smarter: AI Analytics Prompts for E-commerce
DESCRIPTION:
This prompt pack gives Shopify and WooCommerce store owners a ready-to-use toolkit for turning raw store data into clear, actionable insights — no analyst, no technical skills, and no expensive tools required. Whether you're diagnosing why conversions have dropped, figuring out which products to cut, understanding where your best customers come from, or deciding where to spend your marketing budget next month, these prompts do the heavy lifting so you can focus on running your store.
Output Format:
Each prompt is designed to deliver structured, plain-English output — including performance audits, funnel breakdowns, product rankings, customer profiles, and budget recommendations — suitable for day-to-day store management, monthly reviews, and strategic planning.
AI Tools:
Compatible with ChatGPT, Claude, Gemini, and other leading AI platforms. Simply paste your store data and get instant analysis. For best results, use an AI tool that supports file uploads (e.g. CSV or Excel) such as ChatGPT (with data analysis enabled), Claude, or Julius AI.
What's Inside (25 Prompts across 5 categories):
🛍️ Store Performance — Monitor revenue health, spot anomalies, and track growth with confidence
📦 Product Analytics — Identify your winners, cut dead weight, and optimise your product mix
🔄 Conversion & Funnel — Find where customers drop off and fix the leaks that are costing you sales
👤 Customer Behaviour — Understand who's buying, who's leaving, and how to keep them coming back
📣 Marketing Attribution — See which channels are driving real revenue and where to put your budget next
Use Cases
Store Health Checks: Get an honest monthly assessment of how your store is really performing across every key metric
Product Decisions: Know exactly which products to promote, discount, restock, or remove based on data not gut feel
Conversion Optimisation: Identify the highest-impact changes to your funnel and prioritise them by revenue potential
Customer Retention: Spot churn signals early, understand your best customers, and build smarter loyalty strategies
Marketing ROI: Cut wasted ad spend, improve ROAS, and reallocate budget to the channels that actually work
Free Prompts (Taster Pack)
Prompt 1 — Monthly Store Performance Snapshot
Act as an e-commerce analyst. I'm going to share my online store's
performance data for the past month. Please give me a clear,
honest snapshot of how my store is performing.

Cover:
1. Overall revenue performance — is this a good month, average, or concerning?
2. The 3 most important numbers from this dataset and what they tell me
3. One thing that is clearly working
4. One thing that needs immediate attention
5. A one-paragraph plain-English summary I could share with a business partner or advisor

Keep it direct. I want insight, not just a description of the numbers.

Here is my store data:
[PASTE YOUR DATA HERE]
💡 Best data for this prompt: Your monthly store summary — a single month's headline metrics across revenue, orders, and customers.
Shopify: Go to Analytics → Overview → set date range to last month → screenshot or copy the key figures. Or export from Reports → Finances Summary.
WooCommerce: Go to WooCommerce → Reports → Orders → set to last month. Also check Revenue and Customers tabs.
Useful columns to include: Total Revenue, Total Orders, Average Order Value, New Customers, Returning Customers, Conversion Rate (%), Sessions / Visitors, Refunds / Returns, Top Product, Revenue vs Previous Month
Tip: Even a simple copy-paste of your dashboard numbers works here — you don't need a formatted spreadsheet. Just make sure each metric is clearly labelled so the AI knows what it's looking at.
Prompt 2 — Best & Worst Selling Products This Month
I'm going to share product performance data from my online store.
Please analyse it and tell me:

1. The top 5 performing products and what makes them stand out
2. The bottom 5 performing products and whether they are worth keeping, discounting, or removing
3. Any products that are selling well in volume but may be hurting profitability (high returns, low margin signals)
4. One product opportunity I might be overlooking based on the data
5. A clear recommendation on where to focus my product attention next month

Here is my product performance data:
[PASTE YOUR DATA HERE]
💡 Best data for this prompt: A product-level sales report for the current or previous month. Include as many products as you have — the more the AI can compare, the sharper the analysis.
Shopify: Go to Analytics → Reports → Sales by Product. Set date range and export to CSV.
WooCommerce: Go to WooCommerce → Reports → Products → select date range. Or use the Store Sales report if you have WooCommerce Analytics enabled.
Useful columns to include: Product Name, SKU, Units Sold, Gross Revenue, Net Revenue, Average Selling Price, Refund Rate (%), Stock Remaining, Product Category
Tip: If you know your product margins, add a Margin (%) column before pasting — it transforms this from a sales analysis into a profitability analysis, which is far more valuable for decision-making.
Prompt 3 — Where Am I Losing Customers in My Funnel?
I want to understand where potential customers are dropping out of my store before completing a purchase.

Using the funnel and behaviour data below, please:

1. Map out my current funnel and calculate the drop-off rate at each stage
2. Identify the single biggest leak in the funnel — where am I losing the most potential revenue?
3. Suggest the most likely reasons for the drop-off at each stage
4. Recommend 2–3 specific changes I could make to improve conversion at the weakest point
5. Estimate the potential revenue impact if I improved the worst-performing stage by 10%

Here is my funnel and store data:
[PASTE YOUR DATA HERE]
💡 Best data for this prompt: Funnel or behaviour data showing how visitors move through your store from landing to purchase. Even basic session and conversion data is enough to get started.
Shopify: Go to Analytics → Reports → Online Store Conversion Summary. This shows sessions, added to cart, reached checkout, and completed purchase in one view — perfect for this prompt.
WooCommerce: Use Google Analytics 4 (linked to your store) → Reports → Monetisation → Purchase Journey. Or check WooCommerce → Reports → Customers vs Guests for basic conversion signals.
Useful columns to include: Sessions / Visitors, Product Page Views, Add to Cart, Reached Checkout, Completed Purchase, Conversion Rate (%), Cart Abandonment Rate (%), Checkout Abandonment Rate (%)
Tip: If you have device-level data (mobile vs desktop), include it — mobile abandonment rates are almost always higher and pinpointing this adds a very actionable layer to the analysis.
Prompt 4 — What Does My Typical Customer Look Like?
I want to build a clear picture of who my customers actually
are based on real purchase data — not assumptions.

Please analyse the customer data below and tell me:

1. Who my typical customer is — describe them based on their buying behaviour, not demographics
2. The difference between my one-time buyers and my repeat customers — are they buying differently?
3. Which customer type is most valuable to my business and why
4. Any surprising or unexpected patterns in the data
5. One recommendation for how I should adjust my marketing or product strategy based on who my customers actually are

Here is my customer data:
[PASTE YOUR DATA HERE]
💡 Best data for this prompt: Customer-level purchase history showing what people buy, how often, and how much they spend. Works well with 3–6 months of data minimum.
Shopify: Go to Analytics → Reports → Customers → export the Customers by order count or Returning Customers report. The Customer cohort report is also excellent for this.
WooCommerce: Go to WooCommerce → Reports → Customers. Export customer list with order history. For richer data, use the WooCommerce Customers & Orders export plugin or pull from your CRM.
Useful columns to include: Customer ID, Total Orders, Total Spend, Average Order Value, First Order Date, Last Order Date, Days Between Orders, Product Categories Purchased, Location / Country
Tip: Remove any columns with full names or email addresses before pasting — Customer ID is all the AI needs. Never paste personally identifiable information into an AI tool.
Prompt 5 — Which Marketing Channel Is Driving Real Revenue?
I want to cut through vanity metrics and understand which of my marketing channels is actually driving revenue for my store — not just traffic.

Using the data below, please:

1. Rank my marketing channels by revenue generated, not just by traffic or clicks
2. Calculate the true cost of acquisition per channel where spend data is available
3. Identify the most efficient channel — best revenue return per pound spent or per visitor sent
4. Flag any channel that is sending traffic but not converting into sales
5. Give me a clear recommendation on where to focus my marketing effort and budget next month

Here is my traffic, channel, and revenue data:
[PASTE YOUR DATA HERE]
💡 Best data for this prompt: Traffic and revenue data broken down by source or channel. The key is having both the traffic numbers and the revenue each channel generated in the same dataset.
Shopify: Go to Analytics → Reports → Sessions by referrer or Sales by traffic source. The latter is the most useful as it ties revenue directly to channel.
WooCommerce: Use Google Analytics 4 → Reports → Acquisition → Traffic Acquisition. Make sure e-commerce tracking is set up to see revenue by channel. Or use your UTM-tagged campaign data if you track that way.
Useful columns to include: Channel / Source, Sessions, Orders, Revenue, Conversion Rate (%), Average Order Value, Marketing Spend on Channel, Cost Per Acquisition, ROAS
Tip: If you don't have spend data for organic channels (SEO, social, email), just leave those cells blank and note it in the prompt — the AI will work around it and focus the cost analysis on paid channels only.
Prompt 6 — What Can I Do With This Data? (Meta-Analysis Prompt)
I have a dataset and I'm not sure what analysis or insights I could extract from it. I'm going to paste the data (or a sample of it) below. Please review it and tell me: 1. What type of data this is and what it likely represents 2. The 5 most valuable analyses or insights that could be produced from it 3. For each analysis, explain what business question it would answer 4. Which analysis you would recommend starting with, and why I'm a non-technical business owner / marketer, so please keep explanations clear and avoid unnecessary jargon. 💡 Best data for this prompt: Use this as your starting point whenever you have a new dataset and don't know where to begin — it's a diagnostic tool that tells you what's possible before you dive in.
Examples: A fresh export from your CRM, a Google Analytics data download, a spreadsheet of customer orders, ad campaign history going back 6–12 months.
Tip: You don't need to paste the whole dataset — paste the column headers plus 10–20 rows of real data. This gives the AI enough to understand the structure and suggest meaningful analyses without you having to share everything.
Descriptive column names matter most here — Customer Purchase Date is far more useful than Date, and Email Campaign Click Rate (%) beats CTR. The AI will suggest better analyses when it clearly understands what each column contains.