Tool for exporting Google Trends data into Google Sheets
About the tool
The tool consists of a Google Sheet template, and a simple Python code which can be run even by someone who has never run any sort of code before. No installation or special software is required. All you need is Google account so you can use Google Drive.
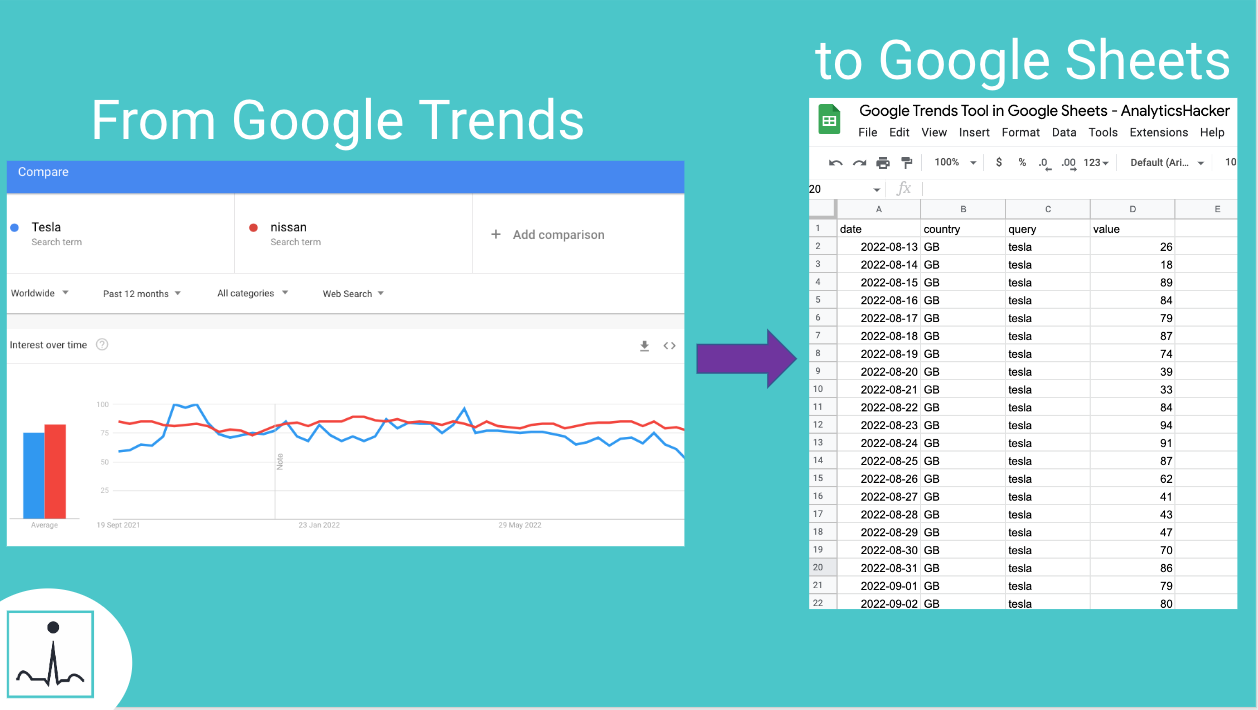
The tool allows to quickly import Google Trends data into Google Sheets, even for a large number of queries (and countries). You do not even need to visit the Google Trends website, as everything is achieved within Google drive itself.
How to use the Google Trends tool
[First use only] Before the first use of the tool, you will first need to make your own copy of two files (Google Sheet template and the accompanying code file; see link in the next section). Then, also as a one off, you will need to open the accompanying code file (name ends with .ipynb) in Google Colab and replace the spreadsheet url in the code to be the one you just created in your Drive. Note that any changes you make in the code will be automatically saved.


Then whenever you want to import Google Trends data into Google Sheet, you simply specify your criteria on the ‘Criteria’ sheet of the spreadsheet. The criteria consist of queries, countries, and date range.
Once criteria are specified, then you run the code (“Play” button in Google Colab window). Within seconds Google Trends data for all your queries should appear in the same Google Sheet file (in the ‘Results’ sheet).
Note that the date range on the ‘Criteria‘ tab can be entered either by manually typing in the dates (in the yellow cells), or by clicking on any of the blue buttons which will pre-populate the date range cells for you.
Make sure that values entered in the Countries column (column G) are using 2-digit geo code (e.g. ‘GB‘, ‘US‘, ‘FR‘, ‘CA‘)


Refreshing the Google Sheet file is as simple as clicking again on the Play button within the code. Re-running will replace all values in the ‘Results’ sheet.
Detailed instructions for using the tool are also included in the ‘Instructions’ sheet of the Google Sheet template (see link below).
You can also watch our video tutorial about the Google Trends tool on YouTube.
Link to our Google Trends Tool in Google Sheets
Google Trends Tool in Google Sheets
Queries vs Topics
Our tool allows to pull data for search queries, as well as for Topics. For example, you could pull Google Trends data for ‘google ads’ query, but also ‘Google Ads’ topic. Both examples are likely to show a different trend due to the fact that the Topic captures various variations of queries related to Google Ads, and so it wouldn’t be limited to just the very exact query = ‘google ads’, but it would also include queries such as ‘adwords’ (i.e. old name of Google Ads).
In order to pull Topic data using our tool, you need to find the topic query code by first visiting the Google Trends website.
To find this topic query code, go to Google Trends website, search for the topic and observe the browser URL. The URL will contain something similar to "explore?q=%2Fm%2F05p0rrx". Your query topic code is the "%2Fm%2F05p0rrx" part of the url. However this code is encoded, and you will need to replace the "%2Fm%2F" part with "/m/".
So, using the example above:
%2Fm%2F05p0rrx becomes /m/05p0rrx .
Once you workout the de-coded version of the topic code, you can then add it to our Google Sheet template in the same way as you would with search queries (column E of the ‘Criteria’ sheet).
Additional information about the tool
there is no limit as such in terms of the number of queries that you can use the tool for, however note that the larger the number of queries you have, the bigger the chance of Google blocking any additional requests. If it does happen, we suggest trying again later, with a reduced number of queries if possible.
The tool pulls each query individually, meaning that you should not use it to directly compare the relative values of the various queries. In other words, you can compare the trend, but not the values (for example, you can check if: “searches for ‘tesla‘ are growing faster or slower than searches for ‘nissan‘“).
the tool is limited to extract trend over time only. It does not currently support extracting Trending Searches.
Version in R
The main tool uses Python, however the library in Python is not updated as fast as the R library. It’s a known problem that the libraries will stop working if Google changes/updates Google Trends. Since the R library is updated faster, we also have a version using the R statistical language.
This version is not streamlined or automated as the Python version is, requiring the user to manually run the different sections, sometimes multiple times. The code is optimized to be used in Posit Cloud (former R Studio Cloud).
Similar to the Python version, you should copy the contents of the folder to your own drive. Afterwards, you should download the R Script and upload it to Posit Cloud.


After uploading the file, you will need to open it, by clicking on the freshly uploaded file. Similar to the python version, you will have to change the Spreadsheet URL to your own, on line 46 of the script.


With these changes, you should be all set to run the script from the start. Follow the instructions on the commented code.